Stars Are Different
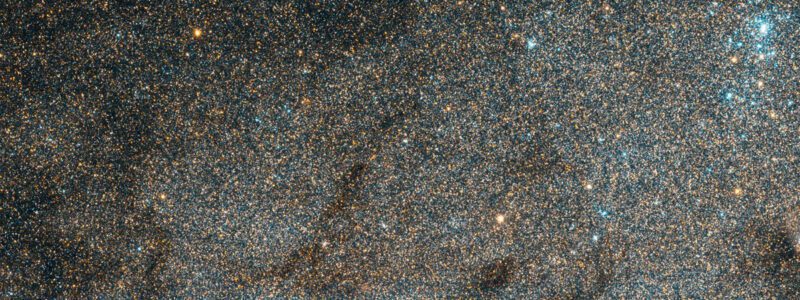
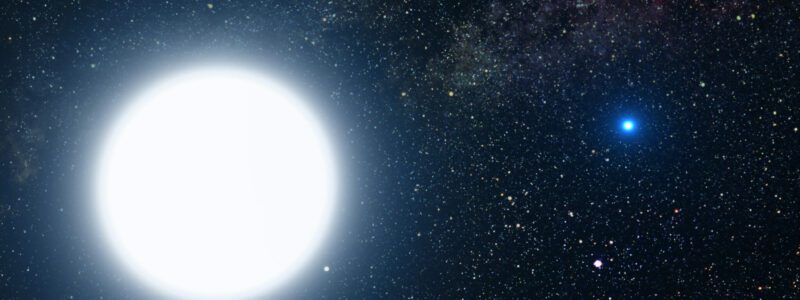
Stars all appear to be about the same; tiny lights in the night sky. However, it may be possible to notice stars of several different colors on a clear night, especially red stars like Antares. Over the last two centuries, much has been learned about differences among the stars and how the two are precisely alike.
It had been assumed that stars were basically the same and that their only major difference was their distance from Earth. Brighter stars were closer, and more distant stars were dimmer. Easy. But wrong.
All The Stars are Nor Equally Bright
William Herschel
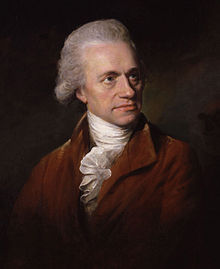
William Herschel was an amateur astronomer in the early 1800s who made monumental discoveries. He initially became famous for discovering the planet Uranus in 1781; he was appointed as Court Astronomer by King George 111. He was also able to discover several moons of Uranus – Titania and Oberon, and two new moons of Saturn – Enceladus and Mimas.
Herschel was an avid astronomer and was able to build several large telescopes. His interest turned to “double stars,” which he thought were two similar stars (as all the stars were thought to be basically the same) which happened to be in a similar direction and appearing very close to each other.
His contribution was that he observed these “double stars” over many years and found – to his amazement – that the stars would appear to move around each other. This meant they were about the same distance from the Earth, but because many were different brightness or a different color from each other, they had to be different types of stars.
Herschel would observe double stars for several decades and identify several such double stars that had one dim star and one bright star. He would to on to term this system a “binary star” in 1802.
This was a momentous discovery, proving that stars are different; all the stars were not identical.
All The Stars at Not White
Ptolomy
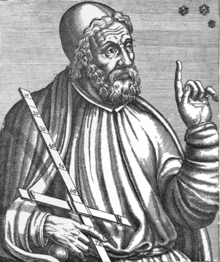
A stargazer’s first impression upon viewing the night sky often is that stars are all white. Observers from areas without significant light pollution know differently. For example, the ancient Greek astronomer from the second century AD identified six stars that seemed to be yellow in color. This was thought to be due to starlight passing through the atmosphere and not representing the actual color of the star.
William Herschel again enters the astronomical picture as he gazed at stars with large telescopes and recognizes different start colors. He particularly notes now certain stars are red (Aldebaran, Arcturus, and Betelgeuse), while others show other colors from yellow to violet. Herschel was unwilling to suppose stars might be of different colors believing the color range had more to do with their proper motion.
Other astronomers believed differently, especially when they observed the two stars in a binary star system to have different colors. These stars were associated with each other making color differences difficult to explain by motion.
By the end of the first half of the 1800s, astronomers slowly realized stars were different by intrinsic brightness and their intrinsic color.
Stars Have Different Light Spectra

Prism Refracting Light
Isaac Newton was first able to demonstrate visible light is a complex blend of multiple colors. He demonstrated this by transmitting light through one side of a prism; the light coming out the other side had different colors ranging from red to blue. We can see these same colors in a rainbow when sunlight passes through water in the air.
Newton presented this discovery in an issue of Philosophical Transactions. Before this discovery, white light was thought to be composed of no colors.
About 130 years later, William Wollaston in 1802 and Joseph Fraunhofer discovered that when sunlight is passed through a prism, the light is similarly split into different colors. But something else was noted that seemed very strange. The light spectrum from the Sun demonstrated hundreds of dark lines.
Fraunhofer would become particularly interested in this phenomenon and published a paper, “The Determination of the Refractive and the Dispersive Power of Different Kinds of Glass.” The concept of light refraction was not new to Fraunhofer because he was an optical lens physicist and manufacturer.
Fraunhofer’s story is interesting. He was orphaned when 11 years old and had to start working as an apprentice to a glassmaker named Philipp Weichelsberger. In 1801 when 14 years old, he was involved in a disaster when his workshop collapsed, burying him in the rubble. Fortunately, there was a rescue operation led by Prince-Electro Maximillian Joseph, who would become the King of Bavaria. The Prince befriended the young Fraunhofer and provided him with books while instructing his employer to allow the boy to study.
The rest is history; Fraunhofer became one of the greatest scientists of his time. The black lines he noted in the Sun’s spectrum are now known as Fraunhofer lines. Fraunhofer would evaluate light from the Moon, Sun, planets, and various stars and identified dark lines within the spectra of these celestial objects – but would not be able to derive an explanation. Unfortunately, as a glassmaker, he was exposed to fumes of heavy metals resulting in his premature death at the age of 39.
Fraunhofer found the same dark lines in the spectra of several bright stars, although they were in different arrangements. Since the lines were different in different stars, Fraunhofer concluded they could not be from the Earth’s atmosphere.
Wavelength
We are all familiar with light – it is around us every day. However, light has a dualism; under certain circumstances, light behaves as a particle (photon), while at other times, light behaves as a wave.
Not all photons are alike; they are different concerning their wavelength. Shorter wavelengths have more energy and longer wavelength photons. X-rays and gamma rays have some of the shortest wavelengths; their high energy makes exposure to them dangerous as they can damage tissue and cause cancers. Longer wavelengths are generally harmless, like the radio waves passing through us all the time.
Light can be colored in different ways depending upon its wavelength. This is because we can “see” only a tiny part of the light spectrum; most of the spectrum is not visible to our eyes. Therefore, when visible light enters our eyes and passes to the retina, the brain perceives different wavelengths of the visible light spectrum as having different colors (if you are not colorblind!).
Infrared Light
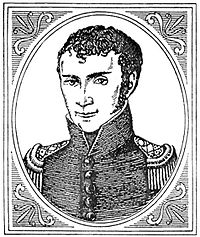
Johann Ritter
William Herschel is also famous for discovering infrared radiation. He tried to measure the room temperature while passing sunlight through a prism by placing the thermometer just beyond the visible red light. Much to his surprise, he found that there was invisible light below the red portion of the spectrum, which heated the thermometer more than the visible light. He discovered that light does not end beyond the red by demonstrating infrared light.
The next question that naturally occurred to scientists was whether there was invisible light above the violet end of the spectrum.
The German chemist Johann Ritter tried to duplicate Herschel’s experiment by evaluating the opposite end of the spectrum. He reasoned that if infrared radiation heated the thermometer, then invisible light next to the violet end of the spectrum should cool the thermometer. Unfortunately, he failed to demonstrate a cooling effect. However, he did show that invisible light next to the violent end of the spectrum would transform silver chloride from white to black demonstrating light energy beyond the violet end of the visible spectrum. This area of the light spectrum above violet was eventually called ultraviolet light.
We now know that silver chloride decomposes into elemental chlorine and metallic silver when exposed to ultraviolet light. Unfortunately, the story of Ritter’s life is rather tragic. He married in 1804 and had four children but could not take care of his family due to financial difficulties. He was chronically ill – possibly due to exposures during his experiments – and died in 1810 at the age of 33, a poor man.
All The Stars are Not the Same Temperature
Scientists have studied how hot objects give off heat. Consider, for example, a hot piece of metal put into a fire or how the coil on an electric stove will glow when it heats up and starts to glow red. The stove is starting to act like a blackbody radiator.
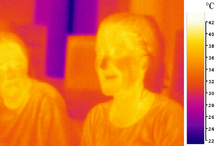
People Seen with Infrared Camera
A blackbody in this context is merely an object before heat is applied to it. However, this definition is incorrect because even people are radiators or heat, which is not visible to the naked eye but would be clearly demonstrated with an infrared filter on a camera.
An object at a temperature of absolute zero or minus 459.67 degrees F would not give off any heat radiation at all. However, as that object gets heated, it will generate heat in a particular way (blackbody radiation).
Blackbody Spectrum
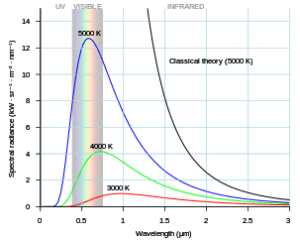
Blackbody Radiation Spectrum
Metal heated to red is not only radiating heat in the red-light spectrum but at a blend of other colors as well.
The wavelength where the blackbody has the most power is called energy. This peak is determined only by the temperature of the object.
Objects at thousands of degrees – like the Sun’s surface – emit radiation mostly in the visible spectrum.
Objects in the hundreds of degrees (like people) emit radiation in the infrared spectrum.
Wien’s Law
Wilhelm Carl Werner Otto Fritz Franz Wien was a German physicist who developed theories concerning heat and electromagnetism and deduced Wien’s Displacement Law which calculates the light emission from a blackbody object at any temperature. His concept was that the wavelength of light is inversely proportional to its temperature.
This took the interest of Max Planck, a college of Wien, who proposed a theoretical basis for Wien’s law which then became the Wien Plank Law which could better describe the entire spectrum of black body radiation.
Importance of Wien-Planck Law
Wien’s law tells us that if you know the wavelength of light a star emits most strongly – the peak of the blackbody radiation curve in Figure 7, then Wien’s law allows the determination of its surface temperature. It does not matter how big the star is, how bright the star might be, or any other physical characteristic.
For example, our Sun emits most of its light in the yellow frequency giving a surface temperature of about 6000 degrees.
Not All Stars Are Made of the Same Material
Astronomers know the composition of many stars out to thousands of light-years away. Since obviously, we can’t sample a star’s content directly.
We know the composition of stars by the characteristics of the light they emit.
To understand how this works, we have to detour and look at elements, electron orbitals, and emitted light.

Spectra of Various Elements
Light often can interact with matter and certain very predictable ways. For example, it turns out that when light is in the form of gamma radiation, ultraviolet, or even visible light, interacts with matter, some of the photon energy particles will strike an electron giving it more energy.
According to quantum theory, electrons orbit around the nucleus only in certain ways. They like to have the least energy possible and reside in an inner orbital; if a photon of a certain wavelength hits them, they might get excited and move up to another level.
The electron can only be excited to that increased energy level, but certain strengths of electrons; other strengths won’t work. When the electron that was excited to an increased energy level falls to a lower energy level, it will emit a photon of a certain wavelength.
Every element has certain energy levels and will only emit certain energy levels (frequencies) of photons when their electrons get excited. These energy levels are specific to each element and even to each isotope of each element.
For example, if there is a tube of gas with sodium atoms and heat that tube with an electric current providing it with an abundance of electrons, some of the atoms in the gas will absorb those electrons and be energized to a higher energy orbit. These higher energy levels are unstable. The electron will drop to a lower energy level and emit a photon; our retina will perceive these photons as glowing. The light from the excited sodium atoms will emit only certain frequencies of light called its emission spectrum.
Evaluating a star’s spectrum will give a good estimation of the elements found within the star.
Large and Small Stars
We can now approach the final piece of the star puzzle. If we have two stars at the same distance (same parallax) and the same surface temperature, one still might be brighter than the other.
The luminosity of a star depends on how much heat a star has on its surface and surface area. Therefore, a larger star of the same temperature or color as a smaller star of the same temperature will appear brighter.
Luminosity is determined by the Stefan-Boltzmann Law, which notes that all else being equal, a star with double the surface area will appear four times the luminosity as it is a square function.
Alternatively, all else being equal, if you double the heat of the surface of a star, its luminosity will go up by a power of four and appear sixteen times brighter.
The equation for luminosity is described as the Stefan-Boltzmann equation:
Luminosity = 4(pi)(radius of star)(constant)(Temperature to fourth power)

Boltzman
Ludwig Boltzmann was an Austrian physicist who is broadly recognized as one of the most brilliant scientists of the twentieth century. He was particularly influential in thermodynamics, and he was a student of Josef Stefan in proposing the relationship derived from the above equation that the total radiation from a blackbody is related to the temperature raised to the fourth power.
Total radiation = (constant)(temperature ^4)
This is important because we can now determine the size of a star if we know its absolute brightness (total radiation) and its temperature (from its color).
Stellar Spectroscopy Becomes Mainstream
Developments in photography coincided with greater abilities to obtain the spectra of any visible star. This convergence was not lost on the Director of the Harvard College Observatory, Edward Pickering. He had a telescope that could image a wide portion of the sky at any given time, star spectrum generating equipment, and photographic skills to generate a catalog of ten-thousand stars by 1890 producing the Draper Catalogue of Stellar Spectra.
The problem Pickering had was how to make sense of all this new data? Was there any connection between the spectra, the elemental constituents of stars, and stellar physics?
To answer this question, Pickering hired a group of women called the Harvard computers. These women initially acted primarily as calculators – doing all the dull work of analyzing thousands of stellar spectra into a classification system. However, some of these women would become scientists in their own rites and publish papers in the scientific literature.
Star Classification System
The first problem Pickering had was to develop some form of the classification system. The initial classification system was based on hydrogen. Initially, there were fifteen classes, with the A-class having the most hydrogen, while the O class had the least. In addition, p and Q classes were reserved for “other” stars that did not fit into the A to O pattern.
The initial supposition was that high hydrogen stars (“A”) should be young stars and likely the hottest, while the low hydrogen (“O”) stars would likely be the oldest and coldest stars.
Recalculating …
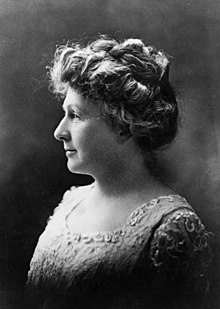
Annie Cannon
Like any scientific inquiry, calculations and classifications often must be redone when further information becomes available. This represented a monumental challenge as thousands of stars had to be reclassified. There were several reclassification systems until Annie Jump Cannon was hired into the Harvard Computer group.
She recognized that the initial order (A through O) was wrong as stellar temperatures depend not on hydrogen lines but on the star’s color (see above). So she reorganized the letters into the sequence we now use – O B A F G K M, while eliminating some categories.
At that time, it was thought the hottest stars (“O”) were the youngest, and as they gradually cooled over time, they evolved from “O” to “M” classification.
This proved not to be the case as the stellar temperature has little to do with the star’s age.
The identification as to how stars “evolved” would be the research topic of two of the greatest astronomers of the twentieth century: Hertzsprung and Russell.
Of Giants and Dwarfs
Annie Cannon determined the temperature of stars relates to their color, with the blue stars being the brightest and the red stars being the dimmest.
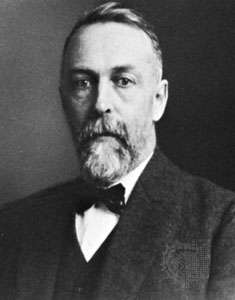
Ejnar Hertzsprung
The next advance came from Danish Ejnar Hertzsprung. He determined the relationships between stellar temperature (as determined by their color) and absolute brightness.
He knew the relationship between temperature and color from Wien’s Law noted earlier. He then determined the distance to multiple stars by noting either their parallax (movement of closer stars relative to more distant stars as the earth moves around the sun). Closer stars moved more than more distant stars.
He then broke down star categories (O B A F G K and M noted above) into distant stars and closer stars by the stellar parallax (or lack of parallax of the more distant stars).
Hertzsprung then noted a problem; red stars tended to be the brightest stars and should be the closest with the largest parallax. However, multiple red stars had no parallax and were therefore far away! He also noted several red stars had large parallax and so must be close!
This was a fundamental problem, and like most fundamental problems in science, it leads to greater fundamental understanding.
He realized that there are some stars of the same temperature that are close (and tend to be dim), while other stars are very bright with the same surface temperature but are far away. Since he knew of the Stefan-Boltzmann equation (noted above) relating absolute brightness to surface temperature and star radius, he correctly surmised the much-most-distant bright red stars must be considerably brighter than the dimmer, closer red stars.
Spectral Line Width and Absolute Brightness
Hertzsprung then made another discovery when evaluating stellar spectra; he noted stars with greater absolute brightness (luminosity) had narrow spectral lines while stars with less luminosity had wider spectral lines. This was another breakthrough because he could now determine a star’s absolute brightness and temperature just by evaluating its spectral lines: stars with higher temperatures were more toward the blue spectrum, and brighter stars and narrow spectral lines.
Henry Norris Russel came to the same conclusions independently; there were both big and little stars of the same spectral types and temperatures. So he referred to the big and little stars as giants and dwarfs, respectively – and the name stuck.
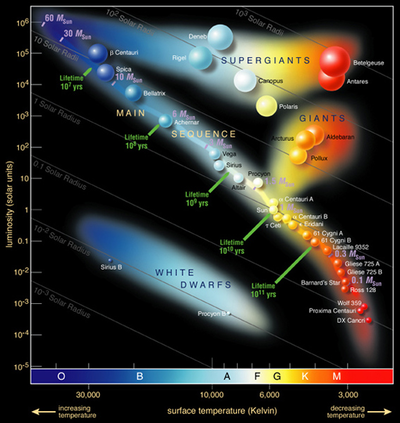 The Hertzsprung – Russell (or HR) Diagram
The HR diagram is one of the great accomplishments of astronomy and relates the absolute brightness of a star to its color spectrum. Hertzsprung and Russell determined that there are two types of red stars – the “red dwarfs” at the bottom right of the diagram. These tend to be dim, cool stars, many of which are close to us. When further away, their dimness makes them much more difficult to spot.
The “red giant” stars are at the upper right of the diagram. These stars are much bigger (“giants”) stars and have cool surface temperatures. These are some of the more familiar red stars in the sky, such as Aldebaran and Rigel.
The mystery was how the red giant stars and the red dwarf stars with the same surface temperature, making them appear red in color, have such different brightness! He found that the red stars with the largest parallax (the closer stars) were much dimmer than those with no observable parallax (, the more distant stars).
The answer is found in the Stefan-Boltzmann equation, which we visited earlier,
Luminosity = 4(pi)(radius of star)(constant)(Temperature to fourth power)
If the temperatures of the red stars are about the same (making them all red), then the brighter, further away stars must have a much greater radius. The diagram graphing absolute brightness on the y-axis and the spectrum on the left axis was published in Nature in 1914. This diagram remains the most important diagram in astronomy
Main Sequence Stars
Most stars (such as the sun) lie on a line from the upper left to the lower right on the HR diagram. These stars makeup what is known as the “main sequence stars” and comprise most of the stars in existence. These “dwarf” stars can determine a star’s absolute luminosity by knowing its spectral type.
Russel showed that the old method of determining distances to stars by measuring their parallax could be replaced by just determining their spectrum. This is fortunate because the determination of a star’s parallax is time-consuming and error-prone. On the other hand, measuring a star’s spectral type is much easier and can be done with stars even at great distances from us.


